
Digital Solutions for Sustainable Shipping
Carbon intensity Index (CII) monitoring
The Carbon Intensity Indicator (CII) is a measure of how efficiently a ship transports goods or passengers. It is given in gramme of CO2 emitted per cargo-carrying capacity and nautical mile. The CII is part of the International Maritime Organisation (IMO) strategy to drive the reduction of short-term greenhouse gas (GHG) emissions. Every year, the CII will have to be calculated and reported to the authorities. A grade from A to E will be associated to the CII score. Each ship will need to achieve a rating of C or better.
The CII requirements will be mandatory from 2023 with the first milestone being a reduction in the carbon intensity of 40% by 2030. The requirements for each grade become more stringent with each passing year.
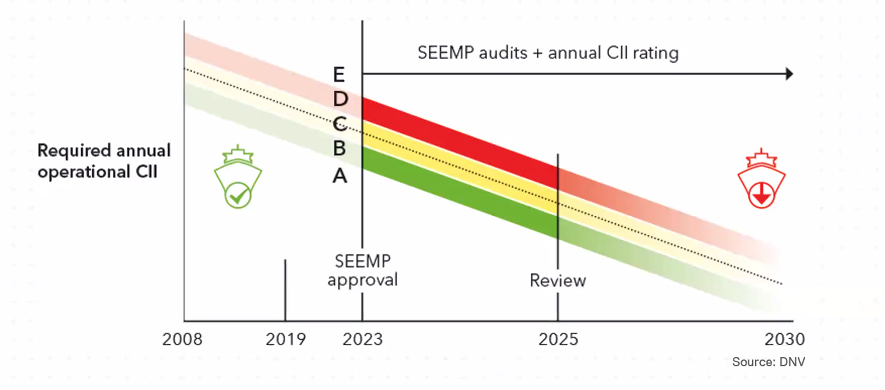
If the ship’s grade is D for three consecutive years, or is E, the ship-owner will have to implement an approved corrective action plan as part of SEEMP to improve the grade.
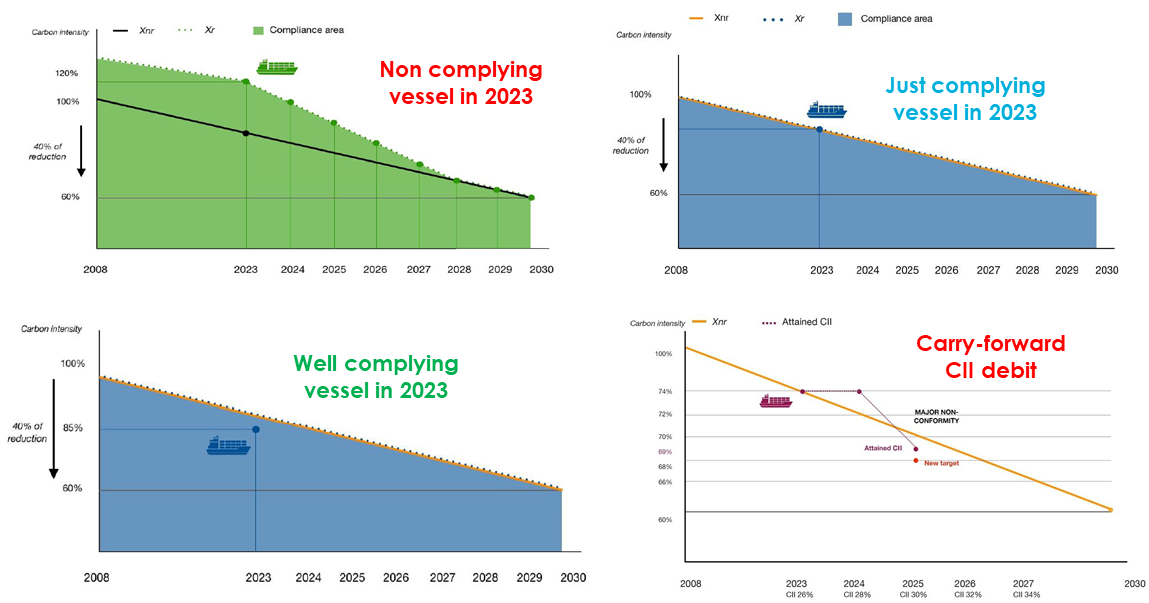
As shown in the examples below (bottom-right chart), falling below the CII target for one year is not enough to erase past years’ non-compliance. Every missed target generates a “carry-forward debit”. This means that the ship needs to overperform in the future if she missed the target previously. Therefore, precise monitoring of the emissions is key, because every ton of CO2 emitted counts in this situation.
© IMO Document
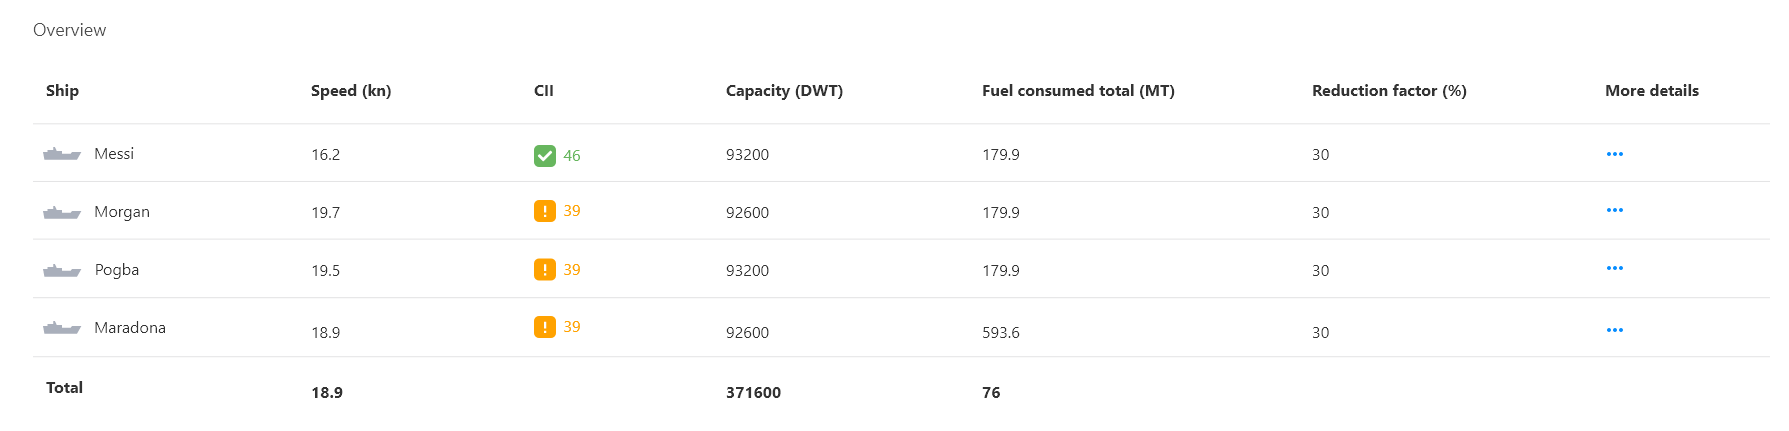
In order to help our customers monitor the CII across their fleet, GTT Digital has released new digital features providing a clear overview of the vessels’ scores and targets. These KPIs also promote continuous awareness to ensure that all vessels are complying with the rating and help identify vessels which need to improve their CII ratings. The CO2 intensities are plotted on graphs for each voyage to clearly reflect CO2 emissions during operations.
© GTT Digital Platform
A long-term time series graph up to 2030 shows the trending of CII for the vessel. This allows proactive decision-making to ensure that the vessel is performing and according to the plan.

© GTT Digital Platform
In addition to the digital solutions, our experts help monitor the compliance and suggest “operational” improvement measures.
Many IMO decisions are expected in 2022 regarding the CII calculation (e.g. Ships with ice class, sailing in sea states at or more than 7 Beaufort, etc.). Therefore, the CII formula will evolve in 2022 and so will our modules with the objective of being fully ready and compliant by January 2023.
Emissions measurement
GTT Digital Online provides a platform that enables comprehensive monitoring and reporting related to the environmental impact of vessel operations. The emission overview is represented in a clear breakdown of total emissions by consumers.

© GTT Digital Platform
The amount of CO2 emitted is calculated from the fuel consumption using the IMO “fuel mass to CO2 mass conversion factors” (MEPC.1 Circ.684 - Guidelines for Voluntary Use of EEOI). The accuracy of the conversion is subject to the fuel quality and the accuracy of all the sensors involved.
Emissions can also be measured directly using our E-met sensor. It is an all-in-one emissions analyser for marine applications. It measures COx, SOx, NOx and CH4. This high performance emission analyser continuously scans the infrared spectrum up to 14μm and can identify gas composition or any specific trace gas with a fingerprint in the infrared. The technology is inherently robust against drift and allows for auto-calibration.
One of the main benefits of the E-met is that is does not require any consumables as a carrier nor calibration gases. The sample gas is analysed directly as it flows through the optical path within the analyser. There are also no moving parts; our analyser incorporates an ultra-stable solid-state IR source with proven long-life time from demanding off-shore applications. The sample cell is designed to be easily detachable for simplified cleaning and maintenance. Overall, the operational cost our E-Met is dramatically reduced compared to other gas analysers.
GTT provides the complete skid surrounding the emissions sensors which integrates very well with the existing systems.

© GTT
The core components include a sample probe, a sample conditioning (cooler and dryer) and an analyser. The gas is cooled down and dried to around 20-30°C before being sent to the analyser where continuous gas concentration is measured. In order to measure the total quantity of gas that escapes the chimney, flow measurement instruments (Differential Pressure Flow Meter or Supersonic Flow Meter) are used. Data is continuously collected, logged and processed by our on-board Data Acquisition Unit. It is treated through tailor-made analytics combined with other measurements in order to extract the maximum amount of insights from it.
Cargo conditioning
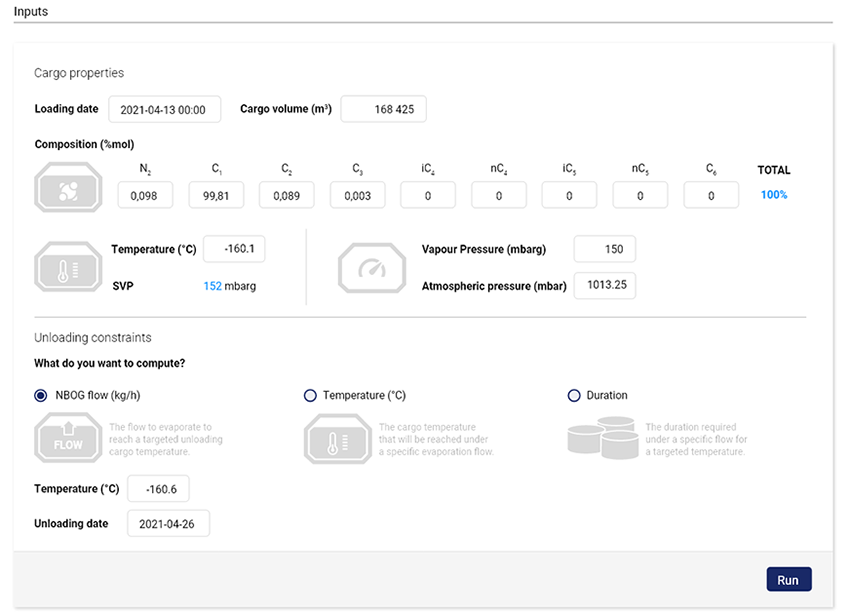
During the laden journey, the constraints on the unloading condition might change. For example, a change in the time of arrival and/or the discharge port. When this happens, the LNG cargo may be in an unfavorable condition for the new discharge terminal. A new module was developed for cargo conditioning for LNG carriers based on GTT’s experience in the LNG process. The tool calculates from the expected unloading condition (eg LNG temperature), the amount of LNG that needs to be consumed, minimizing the cargo loss and thus the emissions. Once the BOG flow that is required to be generate is known, the cargo can be reconditionned to satisfy the charterer’s requirements.
© GTT Digital Platform
Charter-party monitoring
As the regulations are becoming more complex and more stringent, GTT has introduced a new module to monitor and control the charter-party execution based on many criteria like speed and consumption but also CO2, boil off gas and many other parameters. This feature is very useful for both the ship-owners and the charterers.
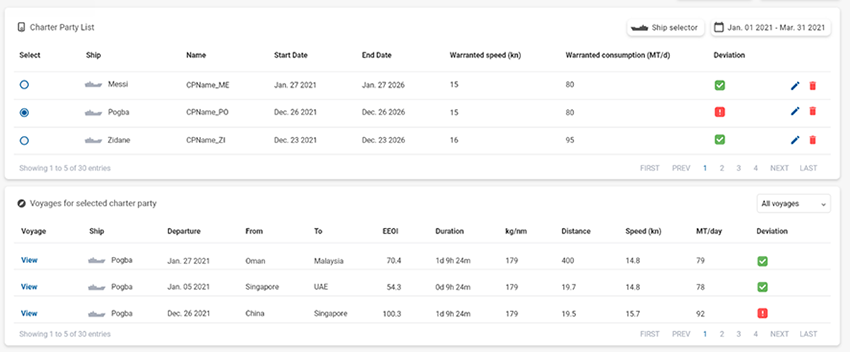
© GTT Digital Platform
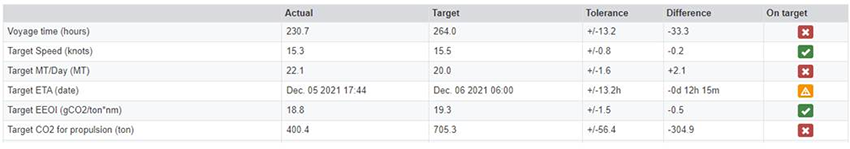
The Time Charter Party requirements can be easily customised and automatically monitored. The tool can track the targets set for each voyages. The KPIs are computed in real-time during the voyage to take immediate corrective measures in case of deviations.
© GTT Digital Platform
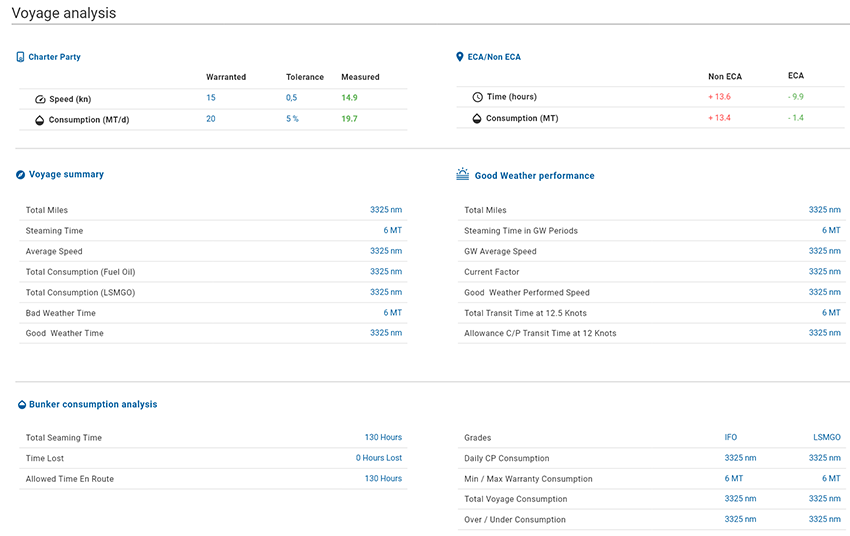
At the end of the voyage, a comprehensive post-voyage report including weather conditions is generated for analysis,
sharing and archiving purposes.
© GTT Digital Platform
Time Charter Equivalent (TCE) Optimisation
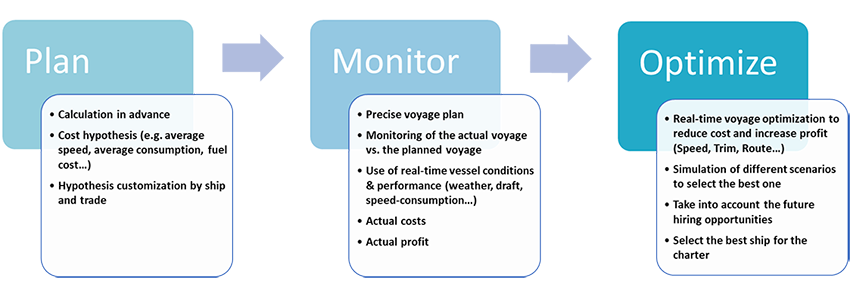
Time charter equivalent (TCE) is a key KPI to quantify the daily net revenue of a vessel. The TCE Optimisation module is designed to help owners, managers and operators optimise their TCE for every leg and voyage. It suggests the optimal voyage parameters in conjunction with the commercial conditions to optimise TCE performance for each voyage. The workflow follows three logical steps:
© GTT
- Planning – Initial calculation using hypothetical values such as average speed, average consumption and fuel cost. This is customisable for a specific ship and trade.
- Monitoring – The on-going voyage is closely monitored and actual voyage information is used to update the calculations. Actual costs and profits can also be further defined.
- Optimisation – Real time voyage optimisation such as speed optimisation, trim optimisation and route optimisation are recommended to reduce cost of voyage and to increase profit. Simulations are carried out to compute for different scenarios where the best can be selected. The optimisation also takes into account the future hiring opportunities and advisory on the best vessel for the charter.
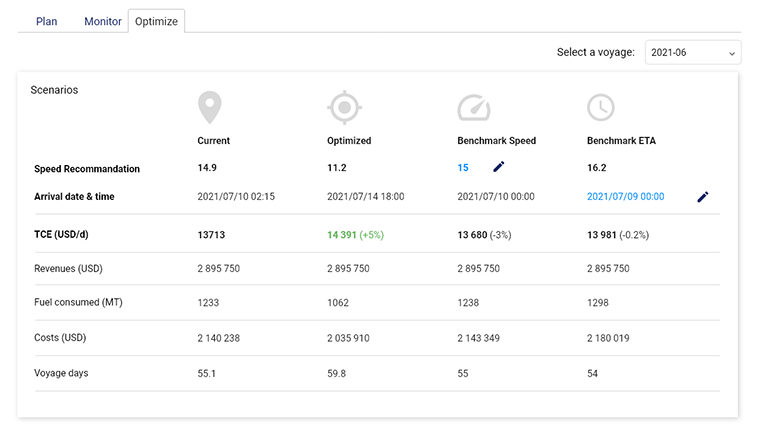
© GTT Digital Platform
The strengths of the TCE solution are:
- Integrated workflow from the planning to the execution.
- Real-time monitoring of the TCE.
- Use of real-time data and performance to optimise the TCE.
- The models can be enriched with various data sources (e.g. bunker price).
- Commercial optimisation with state-of-the-art Artificial Intelligence.
- Interface with commercial and operational tools (e.g. Veson-IMOS).
- Customisable to specific requirements (e.g. cost break-down, result display, etc.).